Start
Admin UI guide
Everything you can see and do in the Admin dashboard, one section at a time. If you just want to log in, see Admin login first — this page picks up from there and walks through every screen you land on afterward.
The Admin dashboard has 16 screens, grouped the same way the left-hand nav inside Admin groups them: Overview, then Resources (agents, registry, threads, runs), Platform (connectors through spend and governance), and Playground (Try agent — exercise a registered graph, not inventory). For each screen below you get four things: what it's for in plain language, what you'll actually see on the page, how to use it step by step, and things that trip people up.
Before you start: getting into Admin at all
Open http://<your-host>:2026/admin/ in a browser. What happens next
depends on whether you turned auth on:
- No auth configured (local/dev) — you land straight on Overview, no login screen. This is normal for a laptop demo, not something to "fix."
-
Auth configured — you get a login card asking for an API key or JWT.
It only accepts a credential that has the
adminpermission — a normal read/write client key will not work here, on purpose (client keys are scoped to one tenant; Admin sees every tenant). Full details, including the exactlanggraph.jsonsnippet to add an admin key, are on Admin login.
Once you're in, the left sidebar inside Admin lists every screen below. Nothing here requires editing a config file to "turn on" — every screen is always present; what changes based on your setup is whether it has data to show (e.g. Cron is empty until you register a scheduled agent) or whether it works at all (the governance screens need a SQL state backend — Postgres, MySQL, or SQLite — and return a friendly "not available on this backend" message on Mongo).
1. Overview
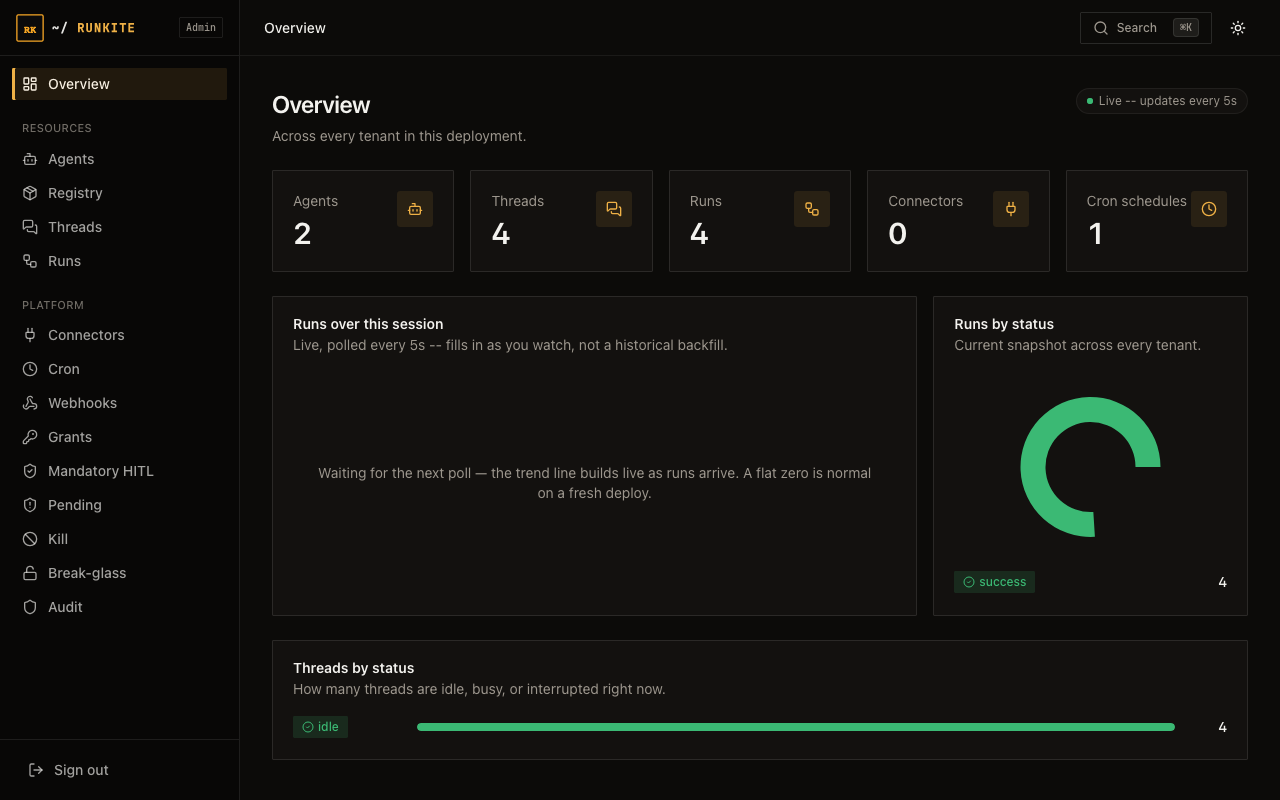
What it's for: the landing page after login. A single glance at how busy the plane is right now, across every tenant.
What you'll see: counts of agents, threads, and runs, with runs broken down by status (pending / running / success / error / interrupted). These are real database counts computed on the spot, not a rough estimate.
How to use it: there's nothing to configure here — it's read-only. Check it after a deploy to confirm the plane sees your agents, or when triage starts ("why do we have 40 pending runs?") as the first stop before drilling into Runs.
2. Agents
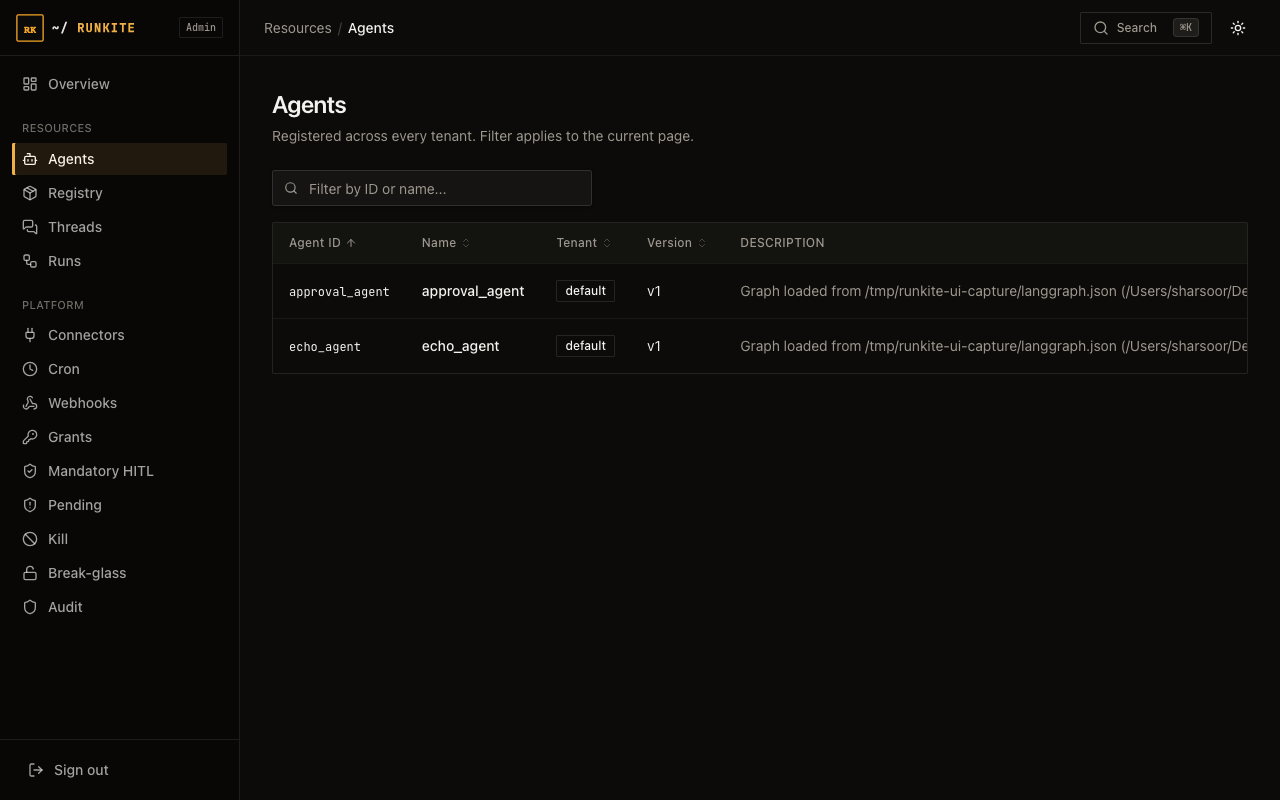
What it's for: the list of every agent the plane currently knows about — the things you can actually create a run against.
What you'll see: agent ID, which tenant it belongs to, and its
declared input/output schema. Agents show up here when the control plane boots and
reads your langgraph.json graphs section (each key becomes a
registered agent) — there is no separate “add agent” button in Admin. Which agents appear
is entirely your config: production ships your graphs only;
docker-compose.dev.yml deliberately points at
examples/all_agents/langgraph.json (echo, react, approval, …) for local
demos — that is not baked into Admin or the product binary.
How to use it: click an agent to see its full detail — schema, version, and metadata. Use this page to sanity-check that a newly deployed graph is actually visible to the plane before you try to run it from a client.
If an agent you just deployed is missing here, check the runner's logs for a config parse error before assuming Admin is broken — this list mirrors the graphs keys bootstrapped from your control plane's langgraph.json. Removing a graph from config does not delete its row from the database; restart with a fresh store (docker compose … down -v in dev) or deploy only the agents you want in prod. If multiple runners are connected, Try agent can fail with Graph not found when a job lands on a runner that did not load that graph — keep CP + runner configs aligned and stop stray local runners.
3. Try agent
What it's for: a built-in playground to exercise any registered agent through the real control plane — same create/stream path a production client uses — without writing a curl command or standing up your own test harness.
What you'll see: a chat panel on the left, a raw Live
protocol feed and per-turn Usage panel on the right. The raw
feed exists on purpose, not as a debug leftover — it's the exact sequence of Agent
Protocol events (metadata, running, values,
end, and interrupt events) your agent emitted for that turn, so you can
see precisely what a client SDK would have received instead of only the rendered
text.
How to use it:
- Pick an agent from the dropdown — only agents the plane already knows about show up here; you cannot author a new one from this page.
- Type a prompt and send it. A real thread and run are created against that agent's tenant, and the reply streams in as it's produced.
- If the agent pauses for human approval mid-run (HITL), an Interrupted banner appears with Approve / Deny buttons right in the chat — resuming replays through the same stream so you see the rest of the run continue live.
- The Usage panel shows that turn's token counts and estimated cost the moment the run finishes; click through to Spend for the tenant-wide rollup.
- Every run you start here is a real run — it shows up in Threads/Runs like any other, counts toward FinOps budgets, and is subject to the same kill switches and policy grants as a production call.
This is deliberately not an agent builder: it runs whatever graph is already deployed. To change what the agent does, edit and redeploy the graph itself — see First agent.
Nav: Try agent lives under Playground in the sidebar (last
group) — it's an action, not inventory like Agents/Registry/Threads/Runs.
LLM keys: Admin does not accept API keys; put
GOOGLE_API_KEY / OPENAI_API_KEY (etc.) in the runner process
before you start it — see Credentials map and
examples/gemini/. Demo agents (echo, react) need no key; scripted replies like
“The answer is 42” mean you picked a fake-LLM test graph, not a live model.
Graph not found: the dropdown lists every agent the control plane has ever
registered; your connected runner may only load a subset — pick one that appears in the
runner's startup logs or align CP + runner langgraph.json. Stop other local
runners (e.g. Gemini dogfood on the same port) if they steal jobs.

4. Registry
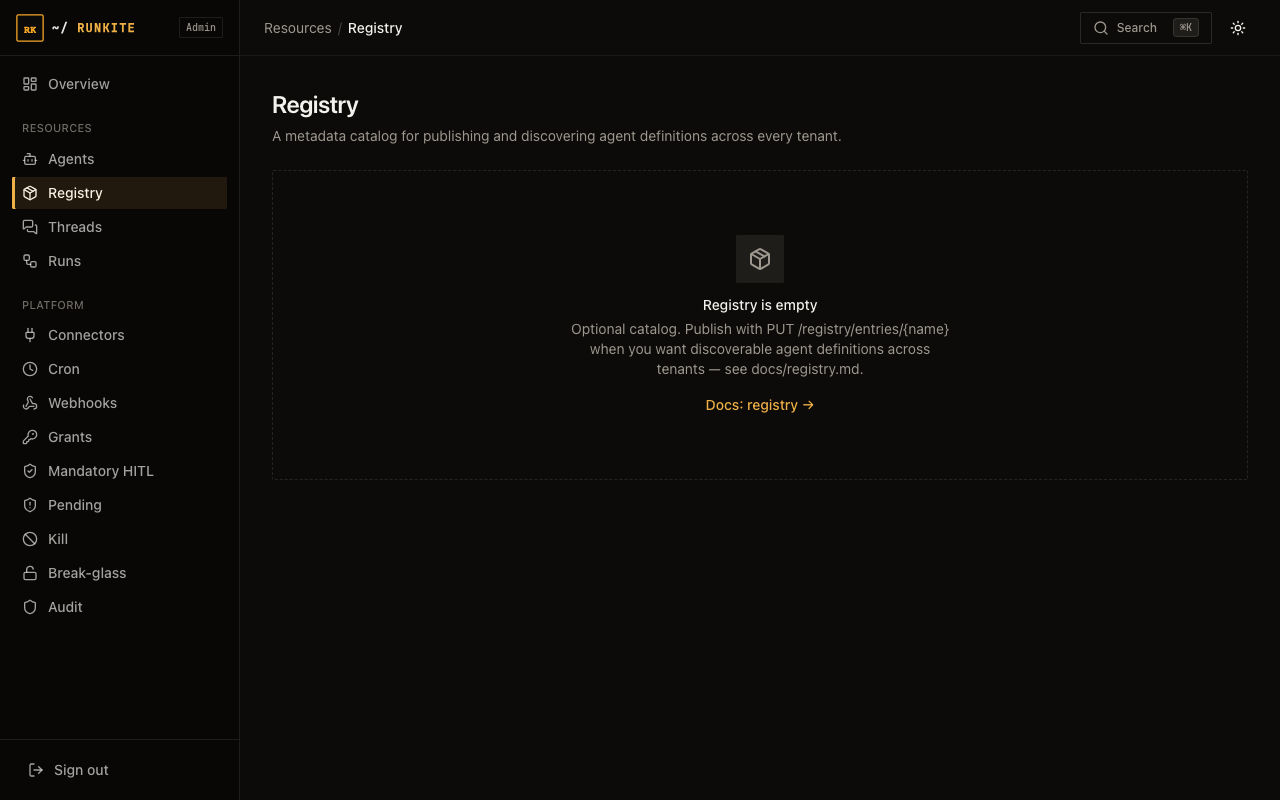
What it's for: a searchable catalog of agent definitions with version history — useful once you have more than a couple of agents and need to answer "what changed in v3 of the support-bot agent, and when."
What you'll see: published entries, each with a version list. Every time you re-publish an agent under the same name, a new version is recorded instead of overwriting the old one.
How to use it: browse or search by name, then open an entry to see
every version that's ever been published, oldest first. Unlike Agents above, this page
is not read-only — click Publish entry to create a new catalog entry,
or open an existing one to edit its metadata or delete it, right from this screen. What
publishing does not do: wire the entry into a running graph. A registry entry
is metadata plus a source_ref (a git URL, a plain URL, or an inline
snippet) — pointing at where the actual code lives, not a copy of the code itself. Making
it a live, callable agent still means adding it to a runner's config and deploying that
runner, same as any other agent; see Registry for the exact
field reference and the API-only equivalent of this form.
5. Threads & Runs
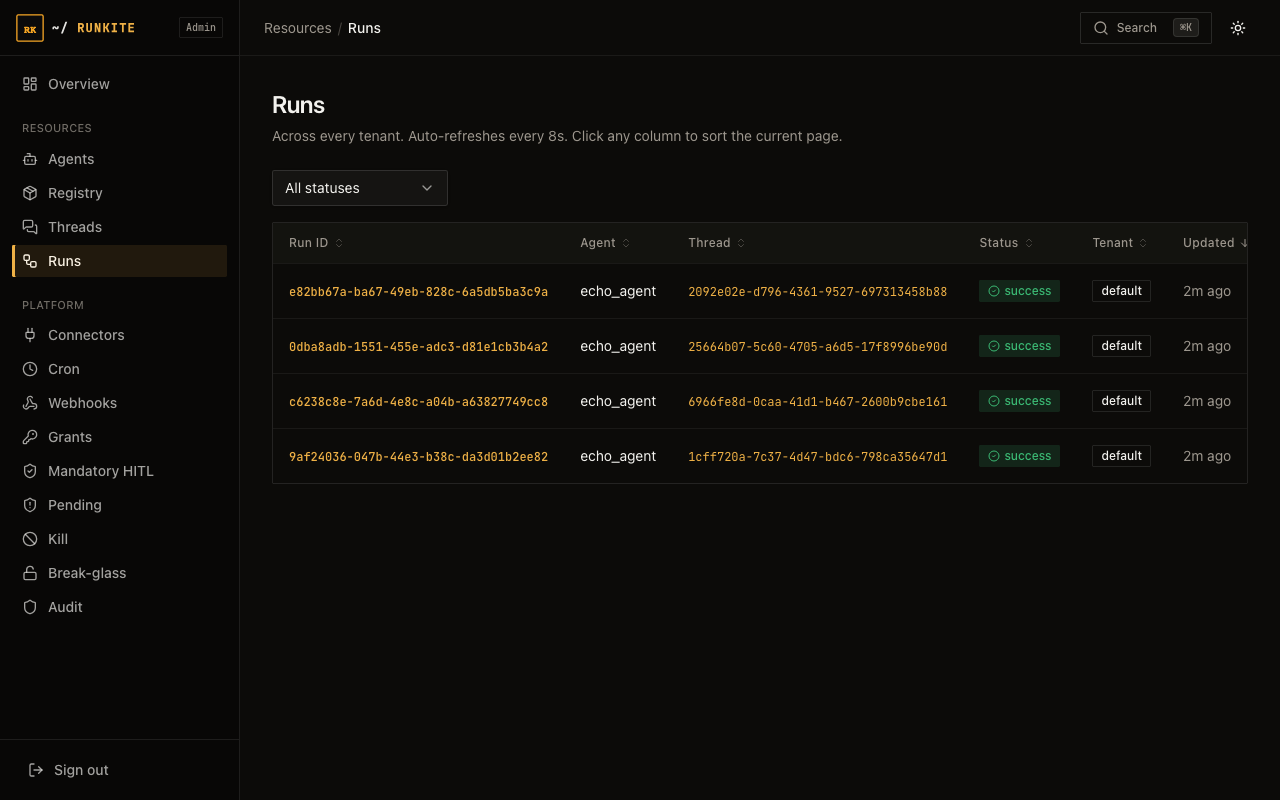
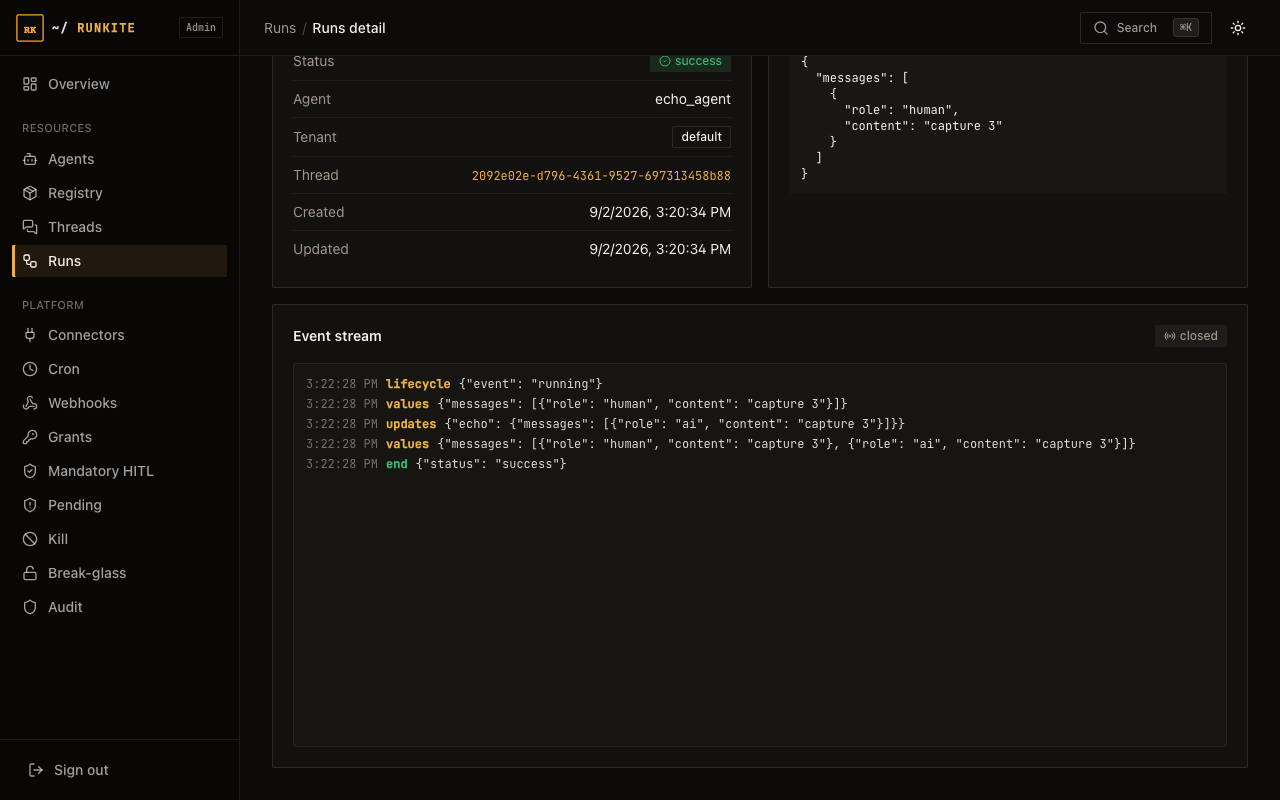
What they're for: the operational core of Admin — this is where you go to answer "what did this specific execution actually do." A thread is a conversation (it can span many turns and many runs); a run is one single execution inside a thread.
What you'll see: Threads lists every thread across every tenant, with a filter by status. Click a thread to see every run that happened inside it. Runs lists every run directly, filterable by status, agent, or thread — useful when you already know the run ID or agent you're chasing and don't want to go through a thread first.
How to use a run's detail page — the part people miss:
- Click into any run from either list to open its detail page.
- You get a live or replayed event stream — the exact same token-by-token / step-by-step events the client SDK would have seen, but viewable after the fact. If the run is still going, it streams live; if it already finished, you're replaying its recorded history.
- This is the single best tool for debugging "the agent did something weird" — you see every tool call, every value the graph produced, and the final status, in order, without needing to reproduce the run yourself.
- Above the event stream (between the input panel and the event log), the Run manifest card answers a different question than the event log: not "what happened" but "what was this run allowed to do the instant it was dispatched" — agent version, runner kind, tool allowlist, whether connector policy was fail-closed, and who requested it. It's frozen at dispatch, so it stays accurate even if you change config afterward. See Run manifest for the full field reference.
- A Cancel action is available on any non-terminal run, from any tenant — useful when something is stuck or looping and you don't want to wait for it to time out on its own.
6. Connectors
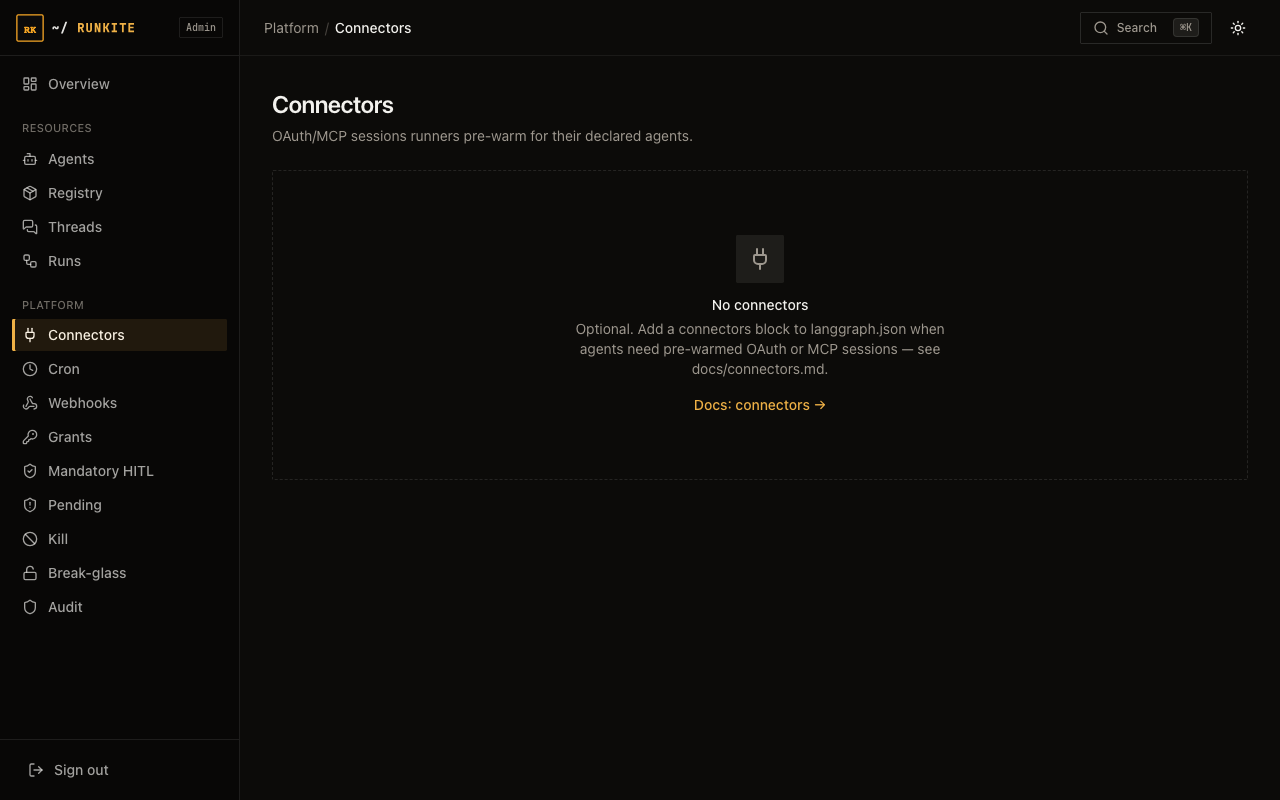
What it's for: a live status board for every external service (Salesforce, GitHub, your internal APIs, etc.) your agents are configured to call through the plane.
What you'll see: each configured connector, whether it's currently healthy, and its circuit breaker state (closed = healthy and calling through normally, open = the plane stopped calling it after repeated failures so a broken third-party API can't take down every agent that depends on it).
How to use it: this page is read-only — connectors are configured in
langgraph.json, not clicked into existence here. Use it to spot a tripped
circuit breaker before a user reports "Salesforce lookups stopped working," and to
confirm a new connector actually loaded after you deployed it. Full configuration
steps (auth types, secrets, tool allowlists) are on the
Connectors & HITL page.
7. Cron
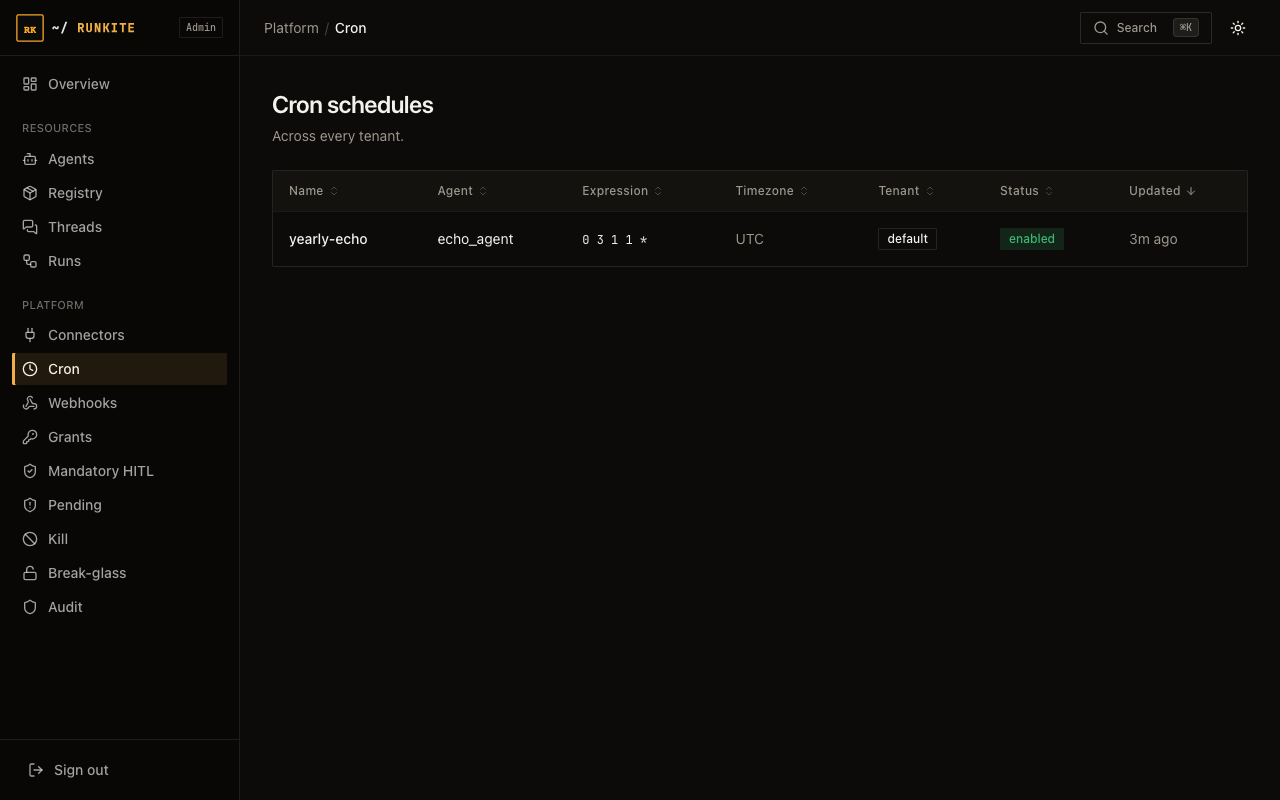
What it's for: visibility into every scheduled ("run this agent every hour") agent across every tenant.
What you'll see: each schedule, its cron expression, and when it last fired. If you're running more than one control-plane replica, this is also where you'd confirm a schedule only fired once — the plane uses a claim mechanism so two replicas racing to fire the same schedule at the same second don't double-run it.
How to use it: read-only here too — schedules are created via the Agent Protocol API or config, not from this screen. Check this page when a scheduled job "didn't run" (is it even registered?) or "ran twice" (did two replicas race — see Cron for the claim mechanism that's supposed to prevent this).
8. Webhooks
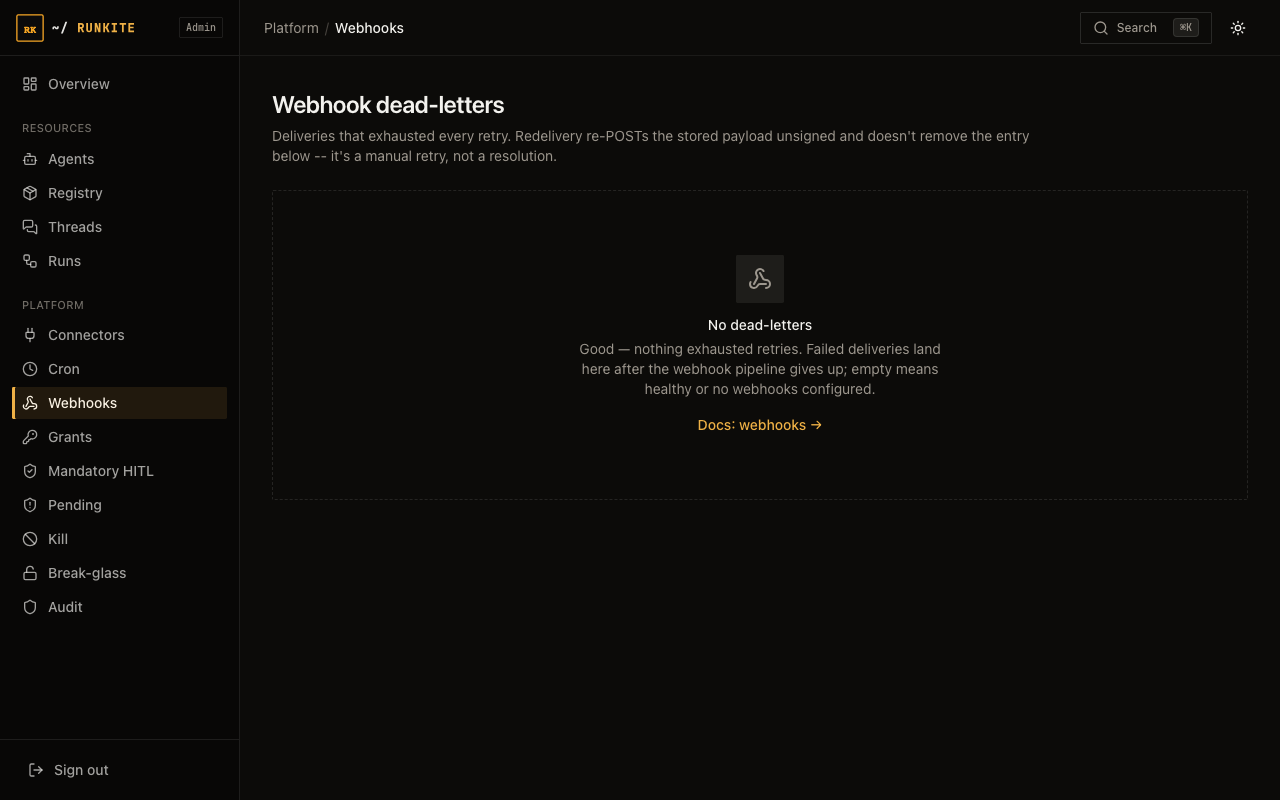
What it's for: Runkite can POST events (a run finished, a tool was called, a policy decision happened) to a URL you configure. This page is where failed deliveries land so you don't lose them silently.
What you'll see: a list of "dead letters" — deliveries that failed after retrying — each with the event payload that was going to be sent.
How to use it:
- Find the failed delivery for the event you're missing on your receiving end.
- Fix the actual problem first (your endpoint was down, returned a 500, etc.) — this page doesn't diagnose that for you.
- Click Redeliver to re-POST the exact stored payload. Note: if your webhook uses a signing secret, the redelivery is not re-signed (the secret isn't kept around after the original send), so a receiver that strictly verifies signatures needs to special-case redeliveries or you re-trigger the event another way.
9. Grants (Policy Grants)
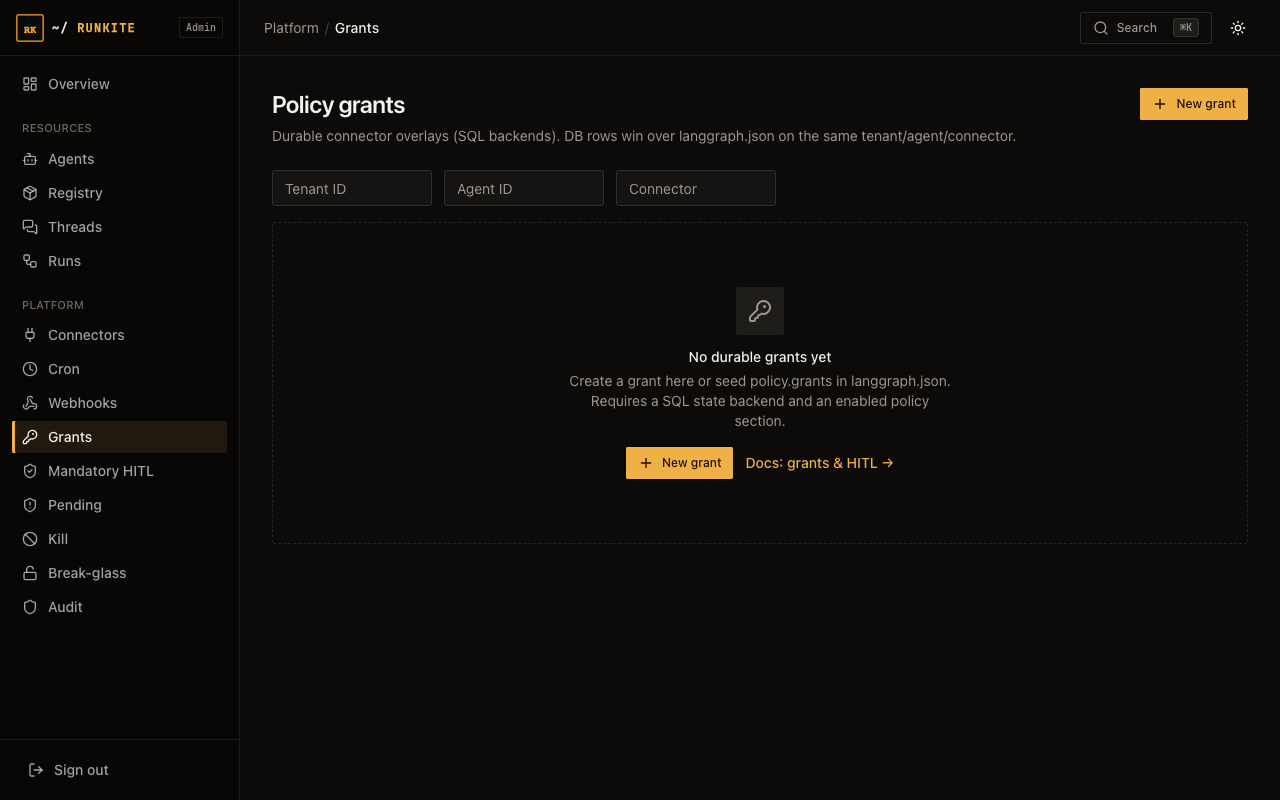
What it's for: the allowlist that decides which agent can use which connector, and which specific tools on that connector. Without a grant, a connector call is denied by default — this is a safety default, not a bug you need to work around by disabling something.
What you'll see: a table of grants — each one says "agent X may use
connector Y" (optionally scoped to specific tool names). You can also set static
grants in langgraph.json; the ones you create here live in the database
and layer on top.
How to create one:
- Click New grant.
- Pick the tenant, the agent, and the connector this grant applies to.
- Optionally restrict it to specific tool names — leave it open to allow every tool the connector exposes.
- Save. The change takes effect on the replica you're talking to immediately, and on every other control-plane replica within about 15 seconds (they poll for changes — there's no manual "sync" step).
Edit or delete a grant the same way, from the same table.
Argument predicates are not this screen. Amount / destination gates live in
langgraph.json as policy.predicates (config-only; restart the control plane).
They run after a matching grant and before the sync webhook, on connector MCP tools/call only.
Copy the example on Grants & HITL → argument predicates.
After a pending or deny, open Pending and hover the Args column —
approve binds that display map (Audit still has digest + args as well).
10. Mandatory HITL
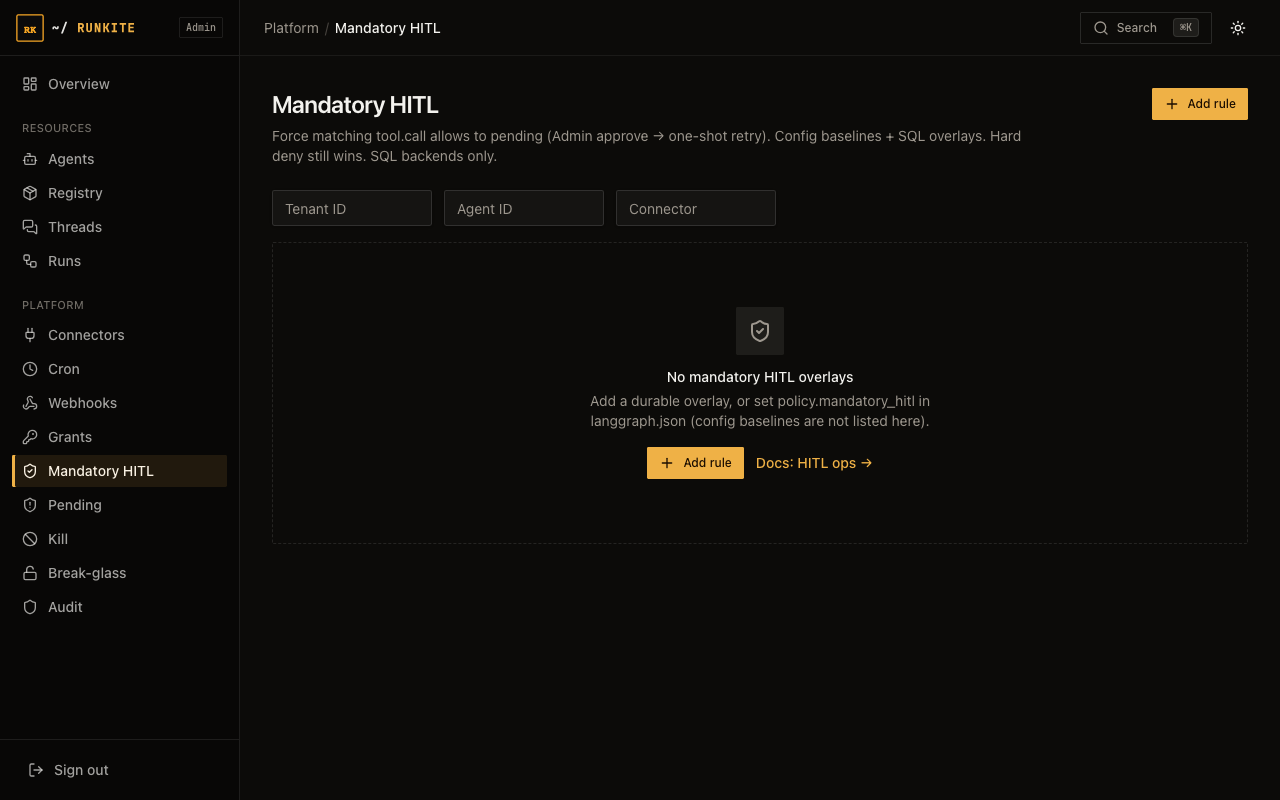
What it's for: force a human approval step for a connector or tool class, regardless of what any grant says. Use this for anything you never want an agent to do fully autonomously — sending an email, making a payment, deleting a record — even if the agent is otherwise trusted with that connector.
What you'll see: a table of rules, each one saying "any call to connector X (optionally, specific tool Y) must pause for approval." Runs that hit a rule here don't fail — they pause and wait, and show up in the Pending screen (next section) for someone to approve or deny.
How to create one:
- Click New rule.
- Pick the tenant, connector, and (optionally) the specific tool. Leaving the tool blank means every tool on that connector requires approval.
- Save. Like grants, this rolls out to every replica within about 15 seconds.
11. Pending (approval queue)
What it's for: the inbox for every connector call that's currently paused waiting for a human — whether it paused because of a Mandatory HITL rule above, or because the agent code itself asked for approval before a sensitive action.
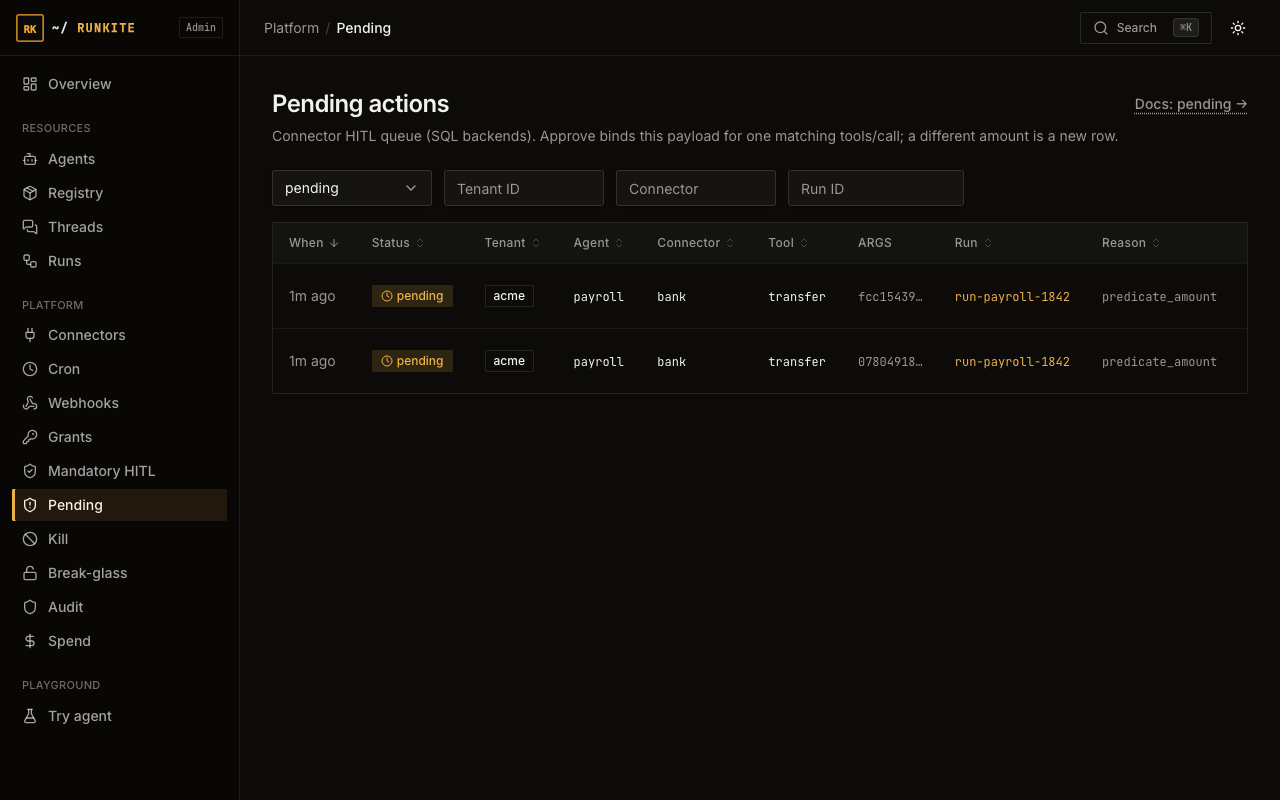
What you'll see: a list of pending actions, each showing which run triggered it, which connector/tool it wants to call, the reason, and the Args display map — so you can see the amount you are binding before deciding.
How to approve or deny:
- Open a pending action and read the connector, tool, reason, and Args column (hover for the display map). Approve binds that payload — a later call with a different amount is a new row, not a silent send.
- Approve — the plane mints a one-shot permission for the next matching call with that same argument digest; the run resumes, and the tool executes normally.
- Deny — the run resumes with a denial instead; your agent code decides what to do next (retry differently, tell the user, give up).
Approving here does not create a standing grant — it's a one-time unlock for this specific paused call. The next time the agent tries the same thing, it pauses again unless you've also added a Grant or removed the Mandatory HITL rule.
12. Kill switches
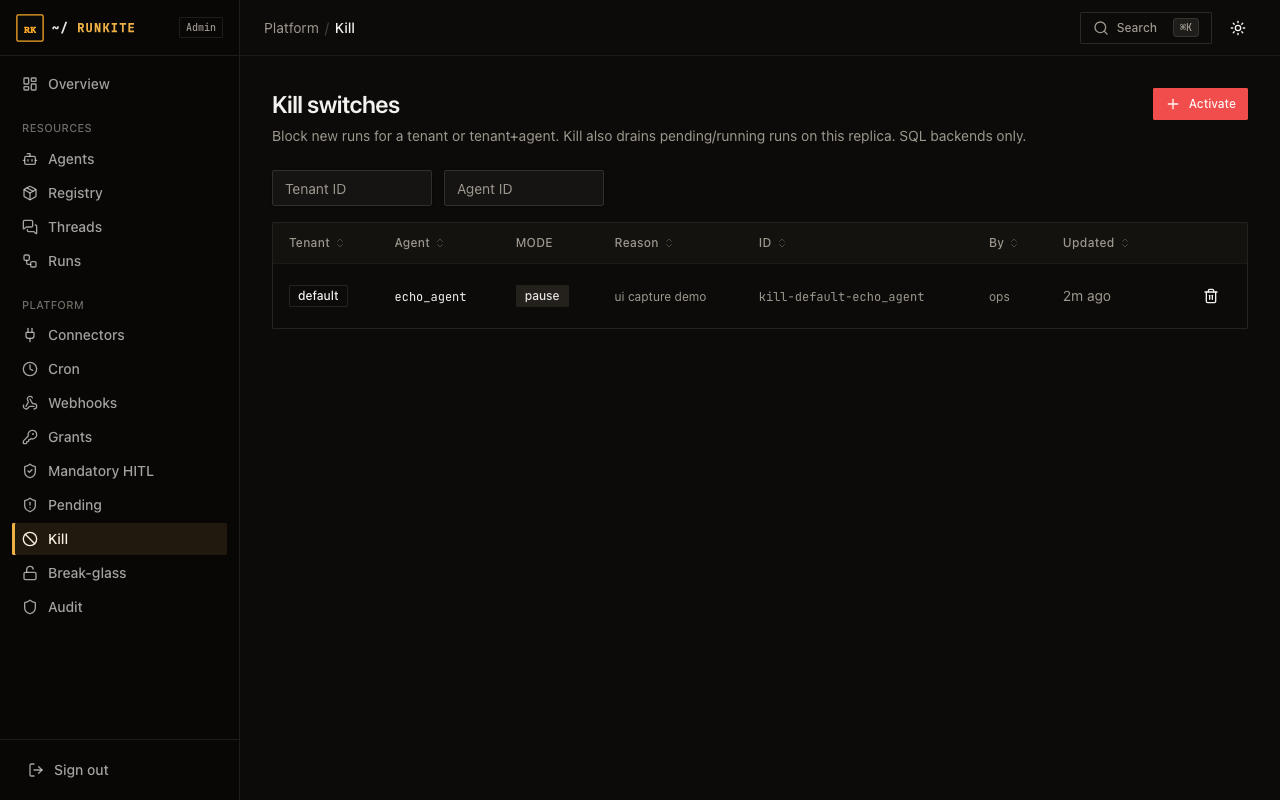
What it's for: the emergency stop button. Use this when something is actively causing harm right now and you need every run for a tenant (or one specific agent within a tenant) to stop immediately, not after a code deploy.
How to use it:
- Pick the scope: an entire tenant, or one agent within a tenant.
- Choose kill (stop new runs from starting and cancel every currently running/pending run in scope) or pause-only (stop new runs from starting, but let anything already in flight finish normally).
- Save. This takes effect immediately — no waiting for a poll interval.
- When the incident is over, come back to this page and clear the switch to resume normal operation.
A kill switch is not the same as Break-glass below — kill always wins. Break-glass cannot override a kill switch, by design.
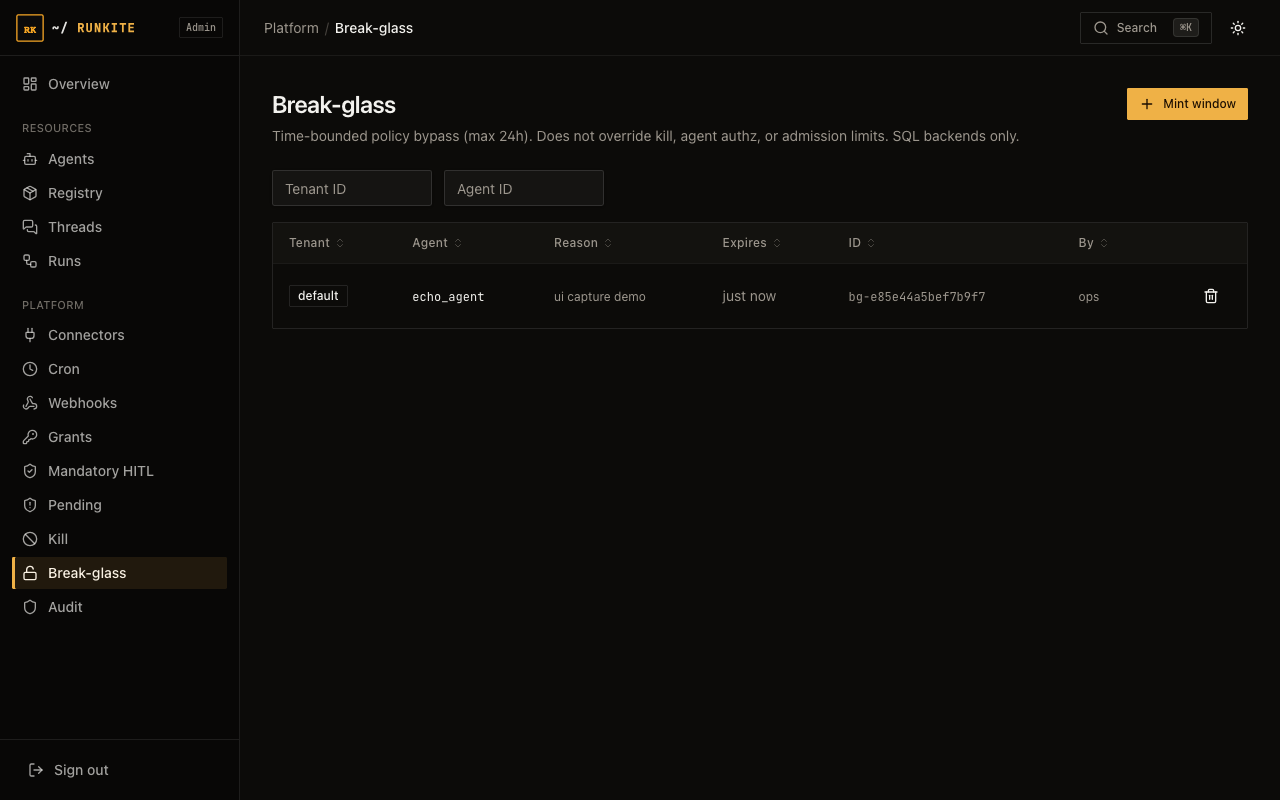
13. Break-glass
What it's for: the opposite emergency tool — a short, time-boxed window where normal connector policy checks are bypassed, for situations like "policy is misconfigured and blocking a legitimate call and we need it to work in the next five minutes while we fix the actual rule."
How to use it:
- Click New window.
- Pick the scope (tenant, or tenant+agent), write a reason (required — this shows up in the audit trail), and set an expiry. The maximum window is 24 hours; you cannot open a longer one.
- Save. Connector policy checks in scope now pass automatically until the window expires or you revoke it.
- Revoke early any time from this same page — normal policy checks resume instantly.
Break-glass only bypasses connector policy decisions. It does not override a kill switch, does not bypass authentication, and does not raise spend budgets or run limits — those are separate controls that stay in force even during a break-glass window.
14. Audit
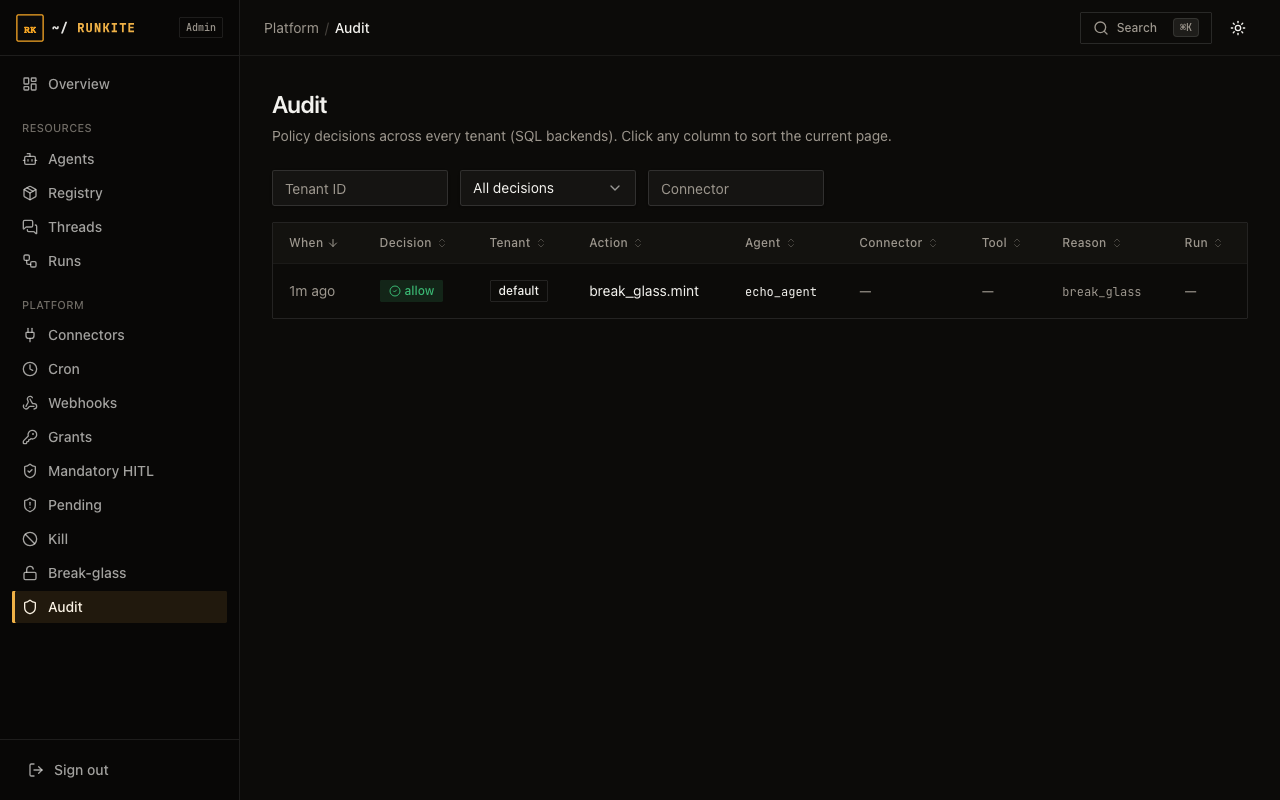
What it's for: the searchable paper trail of every policy decision the plane has made — every allow, every deny, every pending-for-approval, with who, what, and why.
What you'll see: a filterable table — by tenant, agent, connector,
tool, run, or a date range. Each row shows the decision, the reason code behind it,
and which rule (grant, predicate, mandatory-HITL rule, or break-glass window) produced it.
Connector tools/call rows also have an Args column: a short digest, with the
size-capped argument map in the hover (secrets such as token / password are stripped).
How to use it: this is your answer to "prove that agent X was not allowed to touch connector Y last Tuesday" or "show me everything that happened during that break-glass window." Filter down to the scope you care about; there's no write/edit action here — it's a read-only historical record.
15. Spend (FinOps)
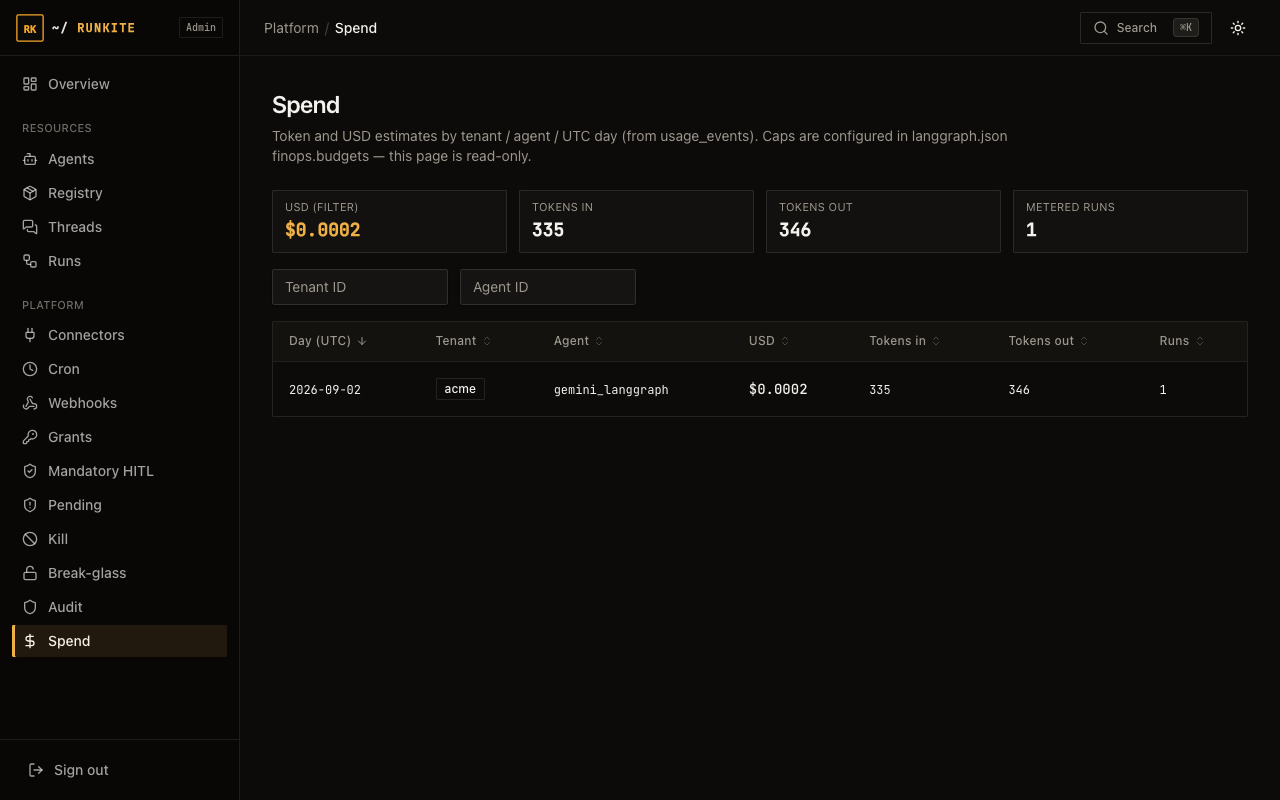
What it's for: how much your agents are actually costing you, and the budget guardrails that stop a runaway agent from generating a five-figure LLM bill overnight.
What you'll see: daily token and estimated USD usage, broken down by tenant and agent, plus any budget alerts that have fired (approaching a limit, a hard cap that blocked new runs, or an in-flight run that got cancelled because a hard cap was breached mid-run). You can also export the usage rollup as CSV or JSON.
How to use it: the langgraph.json finops
section is the bootstrap baseline (a hard cap on USD/tokens/runs per day, per tenant
or per agent) — but you don't need to edit that file or restart the control plane to
change a price or a budget. Scroll down to the Live FinOps config
panel on this same page to add or edit pricebook rates and tenant/agent day budgets
directly. A save here takes effect on this replica immediately and every other
replica within about 15 seconds; Clear overlay reverts to whatever
the file says. The panel always shows file baseline next to
effective (live) so you can tell at a glance whether anything has
been overridden from Admin.
Screens that need a SQL state backend
Grants, Mandatory HITL, Pending, Kill switches, Break-glass, Audit, and Spend all store their data in your state database. On Postgres, MySQL, or SQLite this works exactly as described above. On MongoDB, these screens show a clear "not available on this backend" message instead of failing silently or showing stale data — governance durability on Mongo is on the roadmap, not silently unsupported.
Quick answers to the questions people actually ask
- "I can't log in with my normal API key." — that key doesn't have the
adminpermission. See Admin login for the exact config to add one. - "A run is stuck, how do I stop just that one?" — open it from Runs and use Cancel. Kill switches are for stopping everything in a tenant/agent, not one run.
- "An agent tried something and nothing happened." — check Pending; it's probably waiting on a Mandatory HITL rule or an approval the agent itself requested.
- "I changed a grant and it's not working." — give it up to ~15 seconds if you're on a different replica than the one you edited it on; every replica polls for overlay changes on that interval.
- "Governance pages are erroring out." — you're likely on MongoDB; those pages require Postgres, MySQL, or SQLite.
Reference:
docs/admin.md
(full /admin-api/* route list)
·
Admin login
·
Grants & HITL
·
Kill & break-glass
·
Spend (FinOps)